
The IMG numbers, specialty by specialty
The AAMC's 2026 signal and interview report gives median program-level interview rates for IMG applicants next to MD and DO. This table shows the IMG figures for the specialties where they were reported, with the MD figures beside them.
| Specialty | IMG, signaled | IMG, no signal | MD, signaled | MD, no signal |
|---|---|---|---|---|
| Internal Medicine (gold) | 24% | 1% | 62% | 11% |
| Internal Medicine (silver) | 9% | 1% | 50% | 11% |
| Anesthesiology (gold) | 15% | 0% | 67% | 1% |
| Diagnostic Radiology (gold) | 18% | 1% | 71% | 5% |
| Pediatrics | 24% | 6% | 86% | 59% |
| Family Medicine | 12% | 4% | 78% | 49% |
| Psychiatry | 14% | 1% | 58% | 10% |
| Pathology | 20% | 3% | 62% | 24% |
| Neurology | 13% | 2% | 64% | 20% |
| Surgery | 5% | 0% | 35% | 9% |
| Urology | 7% | 0% | 46% | 2% |
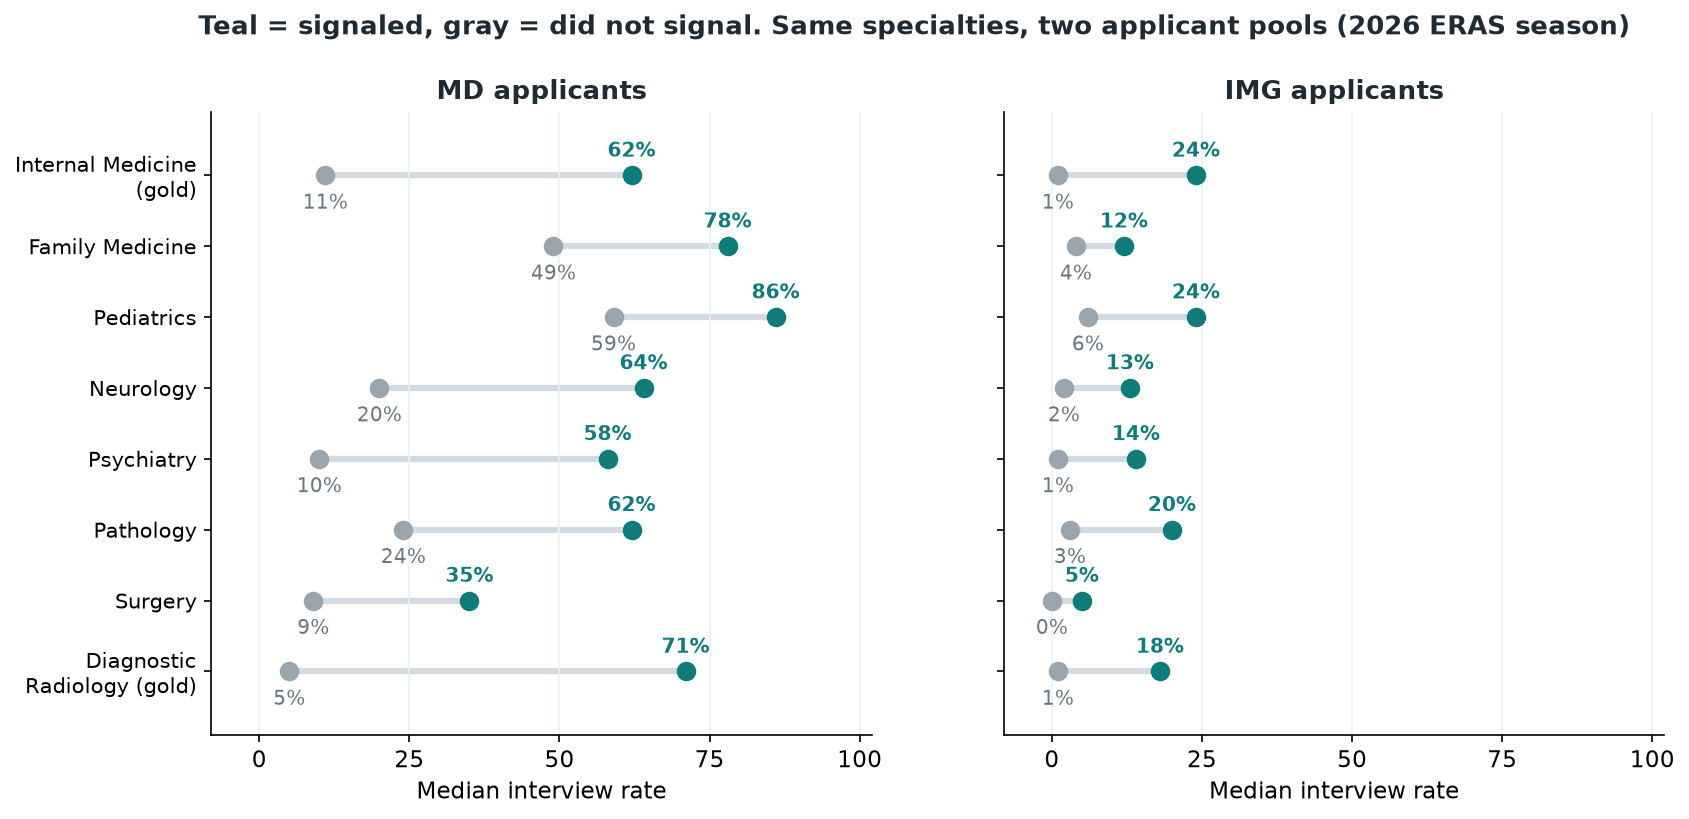
Two things stand out. Signaling moves the IMG numbers more, in relative terms, than anyone else's: in internal medicine a gold signal takes the IMG median from 1% to 24%, a much bigger multiple than the MD move from 11% to 62%. But the absolute rates stay low. The best IMG median in this table is 24%, while MD medians with a signal run from 35% to 86%. That is the practical reality of applying as an IMG, and it points to a longer and more carefully chosen program list rather than to skipping signals.
Why one IMG median can mislead you
In these tables IMGs are one group. That group includes US citizens who studied abroad, non-US citizens who need visa sponsorship and graduates of Caribbean schools, and programs treat those applicants differently. None of the reports we used split IMGs by citizenship or visa status, so a single median blends very different situations.
The median also hides where IMGs actually get interviews. Programs that train many international graduates may interview IMGs at a rate far above the specialty median, while programs that rarely take IMGs pull the median down. The specialty-wide number is not the rate at the programs that consider you, which is why program-level research should drive your list.
Finally, the samples are partial. The report only includes programs that used Thalamus Core and sent at least 10 invitations, and it suppresses applicant groups with fewer than 50 people. In specialties with few IMG interviews, whole cells are blank.
How IMG signal use differs from MD
Among applicants who signaled, IMGs sent slightly fewer signals on average than MDs in several 2027 specialties. In dermatology, IMG signalers averaged 20.8 of 25 silver signals against 24.3 for MDs. In transitional year it was 8.0 against 9.8, in orthopaedic surgery 23.1 against 29.1, in urology 24.3 against 29.6 and in PM&R 15.4 against 19.2.
The gaps look small but they add up. Four fewer urology signals out of 30, or five fewer PM&R signals out of 20, means covering noticeably fewer programs. The data does not explain the difference. It could be deliberate choices, budget limits or uncertainty about which programs consider IMGs. What it does show is that the average in every group is close to the maximum, so leaving signals unused is unusual. Our table of signal limits by specialty shows how many you have in each specialty.
Where IMGs are applying
The October 2026 snapshot of the ERAS 2027 season counts 12,843 IMG applicants to internal medicine, 6,885 to family medicine, 2,785 to pediatrics, 1,828 to transitional year, 1,744 to surgery, 1,115 to neurology and 1,009 to psychiatry. Applicants can appear in more than one specialty, so these numbers should not be added together.
They matter because they set the competition for signals. In the same snapshot, internal medicine programs received an average of 54 IMG gold signals each and family medicine programs an average of 41 IMG signals. Some programs got far more: the most any one internal medicine program received was 625 IMG gold signals. We look at how uneven this is in where program signals pile up, and the applicant counts are in the ERAS 2027 applicant data article.
The same spread exists inside a specialty. An IMG gold signal at a program that routinely trains international graduates is a different thing from one at a program that has never matched one.
What this means for your signal list
Three conclusions follow. First, use all of the signals you have in your specialty, because the no-signal medians are too low to justify holding any back. Second, do not plan around the specialty median. Look at each program's IMG share among current residents, its visa policy and its graduation-year limits, which tell you more than any specialty-wide figure. Third, where signals are scarce, such as the 3 gold signals in internal medicine, give them to programs with a record of training international graduates rather than to the most heavily signaled programs.
That research is what the program pages are for. Each one lists the program's IMG share and visa sponsorship, and you can compare programs inside every specialty. For the other half of the picture, how signaling compares with not signaling across all applicants, see Do residency program signals get you interviews? If you are still choosing a field, our post on the best specialties to match as an IMG is a good companion.